

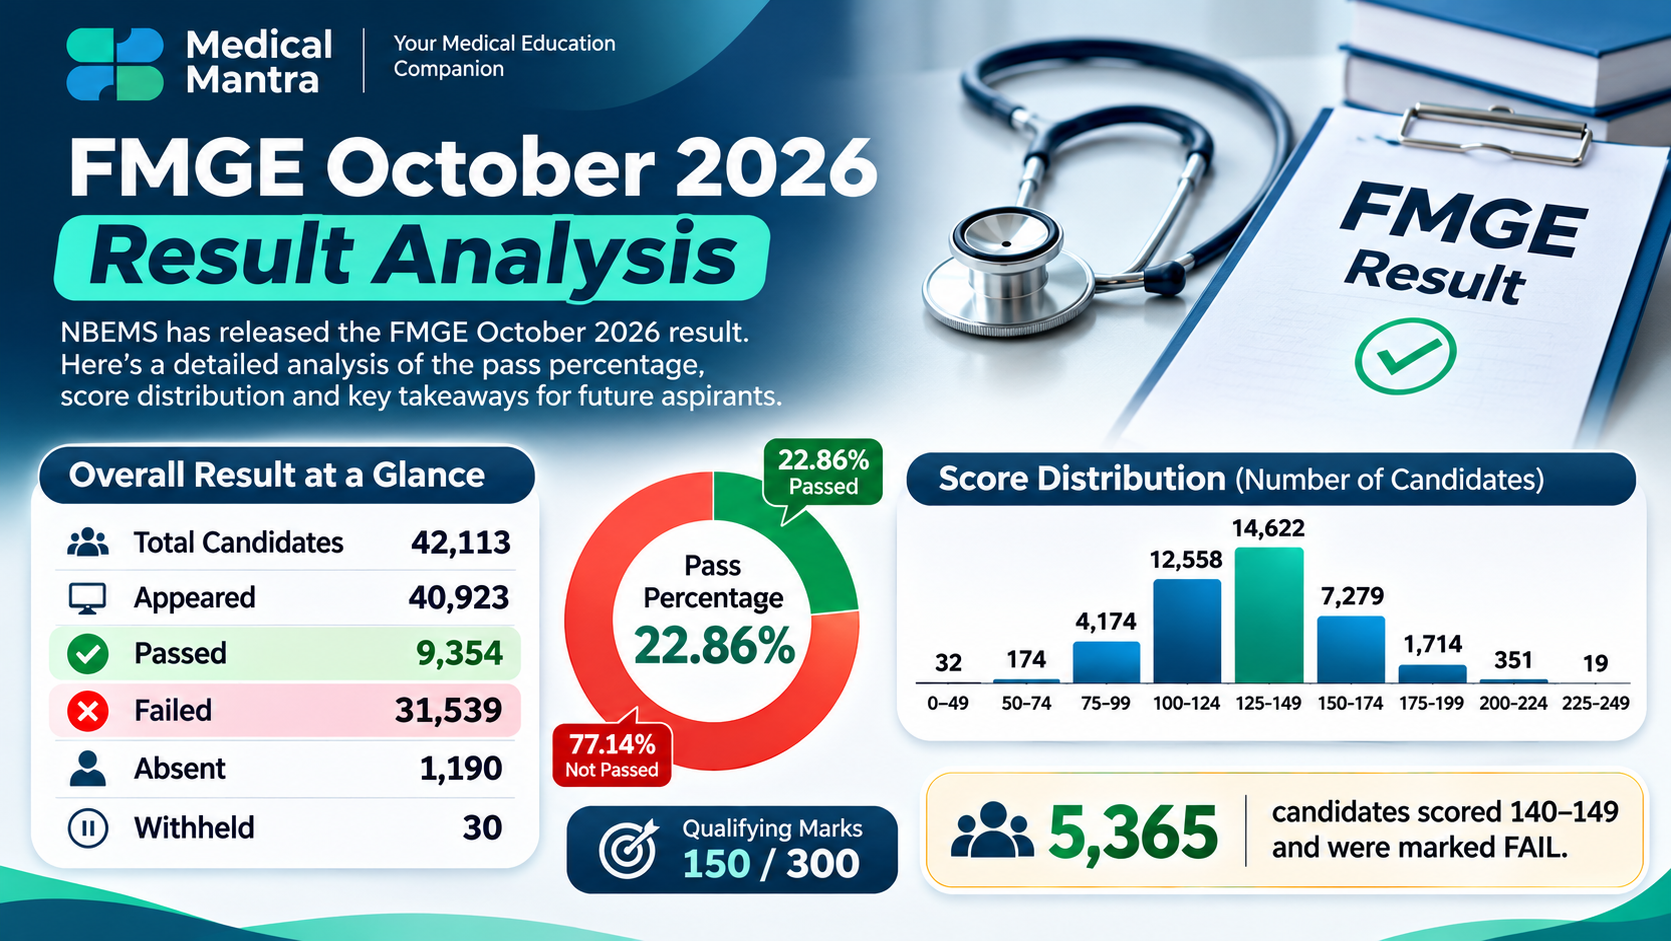
The National Board of Examinations in Medical Sciences (NBEMS) has released the Foreign Medical Graduate Examination (FMGE) October 2026 results. The results reveal a challenging outcome for foreign medical graduates, with only 9,354 candidates qualifying out of 40,922 candidates who appeared for the examination.
The FMGE October 2026 result highlights the continuing challenge faced by foreign medical graduates seeking registration to practise medicine in India. With an overall pass percentage of approximately 22.86%, nearly four out of every five candidates who appeared could not achieve the qualifying score of 150 out of 300.
In this article, MedicalMantra presents a detailed statistical analysis of the FMGE October 2026 result, including the overall pass percentage, score distribution, average marks, candidate performance and important insights for future FMGE aspirants.
FMGE October 2026 Result: Overview
According to the official NBEMS result PDF, the examination result contains 42,112 candidate records.
The overall result statistics are presented below:
| Particulars | Number |
|---|---|
| Total candidates listed | 42,112 |
| Candidates who appeared | 40,922 |
| Candidates who passed | 9,354 |
| Candidates who failed | 31,539 |
| Candidates absent | 1,190 |
| Results withheld | 29 |
| Qualifying marks | 150/300 |
| Overall pass percentage | 22.86% |
Note: The pass percentage is calculated using candidates who appeared as the denominator. Withheld results are not classified as pass or fail.
FMGE October 2026 Pass Percentage
The overall pass percentage for FMGE October 2026 was approximately 22.86%.
Out of 40,922 candidates who appeared:
- 9,354 candidates passed.
- 31,539 candidates failed.
- 29 candidates had their results withheld.
This means approximately 77.14% of candidates did not receive a PASS result in this examination.
The low qualifying percentage highlights the importance of systematic preparation, conceptual understanding, and regular revision for foreign medical graduates.
FMGE October 2026 Score Distribution
One of the most interesting aspects of the October 2026 result is the distribution of candidates across different score ranges.
The following table presents the number of candidates in each score bracket.
| Score Range | Number of Candidates |
|---|---|
| 0–49 | 32 |
| 50–74 | 174 |
| 75–99 | 4,174 |
| 100–124 | 12,557 |
| 125–149 | 14,622 |
| 150–174 | 7,279 |
| 175–199 | 1,714 |
| 200–224 | 351 |
| 225–249 | 19 |
What Does the Score Distribution Tell Us?
Three important observations emerge from the result data:
1. Most candidates scored between 125 and 149
The largest group consisted of 14,622 candidates who scored between 125 and 149 marks. These candidates were close to the qualifying threshold but could not achieve the required 150 marks.
2. A large number of candidates remained below 125 marks
Approximately 12,557 candidates scored between 100 and 124 marks. This indicates that a substantial proportion of candidates need improvement in their overall examination performance.
3. Only a small proportion scored above 200
Only 370 candidates scored 200 marks or higher. This represents a relatively small proportion of the total candidates who appeared.
Average Marks and Overall Performance
| Performance Indicator | Marks |
|---|---|
| Average score | 131.03 |
| Median score | 130 |
| 25th percentile | 113 |
| 75th percentile | 148 |
| Average score of passed candidates | 165.99 |
| Highest score | 249 |
| Lowest numerical score | 0 |